MonoLith Battery Systems
35 kWh Lithium-Ion Battery Packs
162 validated MonoLith configurations from 30 to 40 kWh, 65 to 853 V nominal, up to 477 kW peak.
Configuration Explorer
Each point is one validated MonoLith configuration. Toggle between rated and peak power. Click a point to open it in PackForge.
162 of 162 configurations shown. Click a point to open it in PackForge.
What Limits Each Pack
How many configurations are limited by each factor during full-capacity and peak discharge.
Full-Capacity Discharge Limited By
Collector thermal bound, not energy bound. A copper collector raises the sustained current limit.
Energy bound by cell capacity at the tested discharge rate.
Peak Discharge Limited By
Energy bound by cell capacity at the tested discharge rate.
Collector thermal bound, not energy bound. A copper collector raises the sustained current limit.
Fit Check
Enter your maximum envelope dimensions to see which configurations fit.
Band dimension range: 1,168–1,368 mm L × 803–900 mm W × 170–170 mm H
Open in PackForge with envelopeLoad and Runtime Estimator
Pick a configuration and enter your average load to estimate runtime and cell thermal behavior.
Select a configuration and enter an average load to see estimated runtime.
Cell and Collector Test Data
These charts come from P50B cell tests, collector plate tests, and a drive-cycle simulation of a reference pack. They show the cell and interconnect behavior shared by every configuration on this page; they are not 25 kWh pack test results.
The Cell at the Core
Every MonoLith pack is built around a single cell chemistry we've validated across hundreds of test hours. The pack engineering — collector plates, thermal architecture, wire bonding — is where EVolve adds value. The cell is the foundation we chose carefully, not the product we sell.
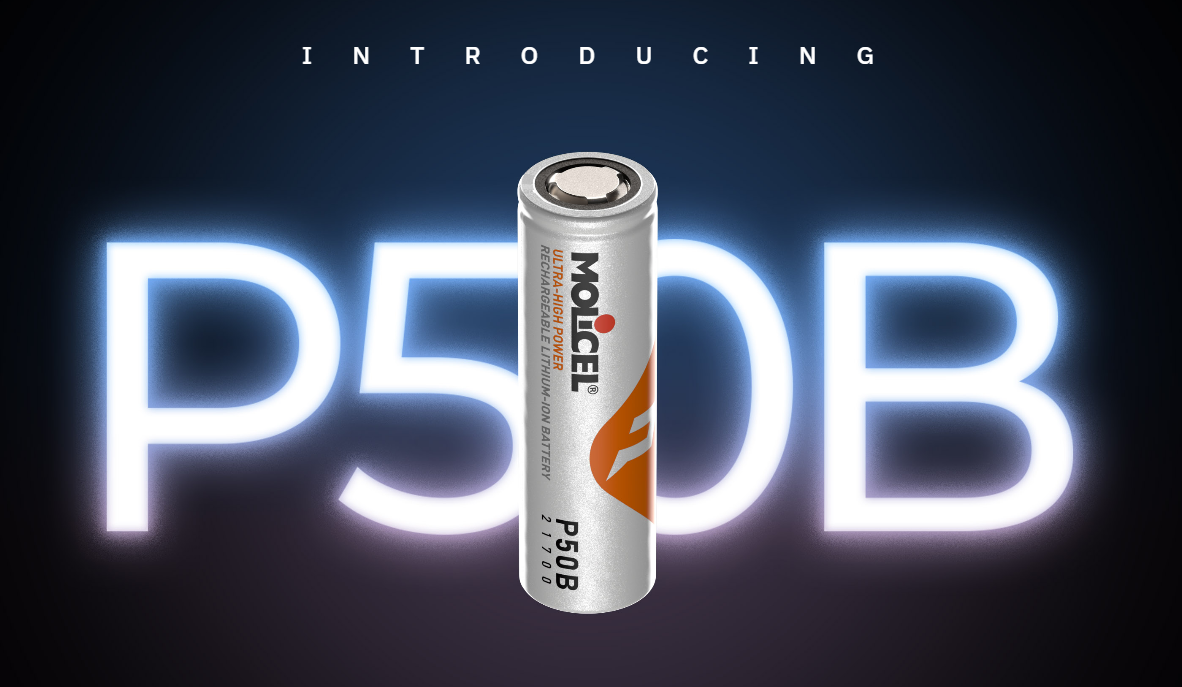
The cell inside every MonoLith pack. A 21700-format power cell chosen for its balance of energy density, discharge capability, and cycle life.
Why This Cell
Silicon-carbon composite anode
The anode formulation is what doubled cycle life from 700 to 1,400 cycles at the cell level. Silicon-carbon composites accommodate more lithium per unit volume than conventional graphite, but managing the volume expansion during cycling is the engineering challenge — and the reason the cycle life gain is real.
High-nickel layered oxide cathode
Higher nickel content pushes energy density and power delivery. The trade-off is thermal sensitivity at high states of charge, which is exactly what the thermal charts on this page quantify.
Low-temperature electrolyte formulation
The electrolyte is formulated to maintain ionic conductivity at low ambient temperatures, extending the usable charge window below 0 °C.
Cycle Life
At 23 °C, cell level, with +1C charge and −100 W discharge. A packed module runs hotter, so real-world cycle life is lower. We model pack-level degradation against your duty cycle and cooling design — the number above is a best-case anchor, not a field prediction.
Peak Power (10 s)
Per cell, 10-second pulse. Pack power scales with cell count. These are manufacturer reference figures — actual sustained output depends on thermal management, which is what the next section explores.
This cell is used in hyper EVs, racing programs, eVTOL, and heavy-lift drone applications. Molicel cells power the McMurtry Spéirling, which holds the Goodwood Festival of Speed hill climb record — a legitimate halo for the cell we build around, and a data point on what the chemistry is capable of in the right hands.
Why a Single "Continuous Power" Rating Is the Wrong Question
A vehicle doesn't draw constant peak power. Load profile and thermal management determine what a pack actually delivers. These three stories show why — using measured test data and engineering models from our Molicel INR-21700-P50B cell testing.
Discharge Rate Changes What You Get
At low rates the cell delivers full capacity. At high rates it heats up, hits its 80°C limit partway through, and terminates early with less than half its capacity delivered. There is no single "continuous" number — there's a curve.
Copper Collector Plates: When They Matter
At low current, aluminium and copper both run cool — copper is overkill. As current rises, aluminium heat-soaks quickly while copper stays flat. At high current aluminium exceeds its limit and copper doesn't.
Real Duty Cycles vs. Constant-Load Rating
A simulated vehicle drive cycle (hard acceleration, cruising, regen, stops) against the same pack held at constant peak power. The drive cycle stabilises comfortably; the constant load exceeds the cell limit in minutes. Same pack, same cooling.
The right question isn't "what's the continuous rating?"
It's "what does my application actually draw, and how does the pack handle that?"
Request a Thermal AssessmentLiquid Cooling, Proven on Hardware
Four modules in one pack. Same cells, same current, same instant. Two had the conductive pad removed — a 2 mm air gap to the cold plate. Two were actively liquid-cooled. The temperature difference between them is the cooling system's effect and nothing else.
| Test | Pack Current | Load Duration | Uncooled Peak | Cooled Peak | Benefit | Uncooled Hit Limit |
|---|---|---|---|---|---|---|
| CH1 | 180 A | 28.9 min | 47°C | 36°C | 11 K | No |
| CH2 | 360 A | 10.1 min | 52°C | 43°C | 9 K | Yes |
The 360 A run is the one that matters
The uncooled modules reached the 53°C test limit and the run ended. The cooled modules sat at 43°C with 10 K of headroom. Cooling didn't just lower a number — it was the difference between finishing the run and stopping.
What this test is — and isn't
A physical test on a real four-module pack. Peak temperatures are measured from the test report; curve shape between start and peak is reconstructed from published figures. The 53°C line is a test limit, not a cell limit — the cells tolerate considerably more. This shows cooling works and by how much at these currents; it does not establish maximum heat rejection.
Full Configuration Table
162 configurations. Click any part number to open it in PackForge.
| Part Number | V ↑ | kWh | Ah | Rated kW | Peak kW | Hold (min) | Mass (kg) | Wh/kg |
|---|---|---|---|---|---|---|---|---|
| 1SPC-018S4P-031.1A5 | 64.8 | 31.1 | 480 | 97.2 | 97.2 | 19 | 287 | 108.2 |
| 1SPA-018S4P-031.1A5 | 64.8 | 31.1 | 480 | 97.2 | 97.2 | 19 | 225 | 138.1 |
| 1SPA-019S4P-032.8A5 | 68.4 | 32.8 | 480 | 102.6 | 102.6 | 19 | 234 | 140.2 |
| 1SPC-019S4P-032.8A5 | 68.4 | 32.8 | 480 | 102.6 | 102.6 | 19 | 299 | 109.7 |
| 1SPC-020S4P-034.6A5 | 72.0 | 34.6 | 480 | 108.0 | 108.0 | 19 | 311 | 111.0 |
| 1SPA-020S4P-034.6A5 | 72.0 | 34.6 | 480 | 108.0 | 108.0 | 19 | 243 | 142.2 |
| 1SPC-021S4P-036.3A6 | 75.6 | 36.3 | 480 | 113.4 | 113.4 | 19 | 334 | 108.8 |
| 1SPA-021S4P-036.3A6 | 75.6 | 36.3 | 480 | 113.4 | 113.4 | 19 | 261 | 138.9 |
| 1SPC-022S4P-038.0A6 | 79.2 | 38.0 | 480 | 118.8 | 118.8 | 19 | 346 | 110.0 |
| 1SPA-022S4P-038.0A6 | 79.2 | 38.0 | 480 | 118.8 | 118.8 | 19 | 270 | 140.7 |
| 1SPC-023S4P-039.7A6 | 82.8 | 39.7 | 480 | 124.2 | 124.2 | 19 | 358 | 111.1 |
| 1SPA-023S4P-039.7A6 | 82.8 | 39.7 | 480 | 124.2 | 124.2 | 19 | 279 | 142.5 |
| 1SPA-024S3P-031.1A5 | 86.4 | 31.1 | 360 | 111.5 | 129.6 | 14 | 225 | 138.1 |
| 1SPC-024S3P-031.1A5 | 86.4 | 31.1 | 360 | 129.6 | 129.6 | 14 | 287 | 108.2 |
| 1SPA-025S3P-032.4A5 | 90.0 | 32.4 | 360 | 116.1 | 135.0 | 14 | 232 | 139.7 |
| 1SPC-025S3P-032.4A5 | 90.0 | 32.4 | 360 | 135.0 | 135.0 | 14 | 296 | 109.3 |
| 1SPA-026S3P-033.7A5 | 93.6 | 33.7 | 360 | 120.7 | 140.4 | 14 | 239 | 141.2 |
| 1SPC-026S3P-033.7A5 | 93.6 | 33.7 | 360 | 140.4 | 140.4 | 14 | 305 | 110.3 |
| 1SPA-027S3P-035.0A6 | 97.2 | 35.0 | 360 | 125.4 | 145.8 | 14 | 255 | 137.4 |
| 1SPC-027S3P-035.0A6 | 97.2 | 35.0 | 360 | 145.8 | 145.8 | 14 | 325 | 107.8 |
| 1SPA-028S3P-036.3A6 | 100.8 | 36.3 | 360 | 130.0 | 151.2 | 14 | 261 | 138.9 |
| 1SPC-028S3P-036.3A6 | 100.8 | 36.3 | 360 | 151.2 | 151.2 | 14 | 334 | 108.8 |
| 1SPA-029S3P-037.6A6 | 104.4 | 37.6 | 360 | 134.7 | 156.6 | 14 | 268 | 140.3 |
| 1SPC-029S3P-037.6A6 | 104.4 | 37.6 | 360 | 156.6 | 156.6 | 14 | 343 | 109.7 |
| 1SPA-030S3P-038.9A6 | 108.0 | 38.9 | 360 | 139.3 | 162.0 | 14 | 275 | 141.6 |
Page 1 of 7 — showing 25 of 162 configurations
Multi-pack configurations combine identical MonoLith packs; see PackForge for wiring and interconnect details.
Frequently Asked Questions
Configurations in this band span 64.8 V to 853.2 V nominal.
Mass ranges from 221 kg to 358 kg across the 162 configurations.
Cell models in this band: INR-21700-P50B (162 configs).
Cooling methods: Liquid cooled, -8 AN fittings (162 configs).
Yes. Use PackForge to filter by any voltage, energy, or power band, or submit an RFQ for a custom configuration.
Apply this to your program
EVolve Battery Systems designs and manufactures custom lithium-ion battery packs in Boulder, Colorado. Every MonoLith configuration on this page is built on the same engineering platform.